

Now that it’s summer I have been trying to find fun outdoor activities to keep up on our preschool lessons. To make sure my oldest is fully ready for Kindergarten. We’ve been keeping up with our reading lessons, daily. We also try to count to 100 most days. Besides counting to 100 my husband and I find ways to sneak in counting and simple addition activities. I’ve been focused on pre reading and reading skills that math got lost in the shuffle of it all therefore I’ve been trying to be more proactive in fitting it in much more often.
Again; being summer I’ve been trying to find a way to bring our lessons outside as we breath in the fresh air and soak in nature. My youngest enjoys watching birds, squirrels, and bunnies. Luckily for her our backyard is full of tall trees and is the perfect place to look for small critters. I figured a way to keep both my daughters more excited about nature I’d make something I could laminate and take outside with us to mark off what we see.

My daughter pointed out the lady bug on the chart and asked why a lady bug? I told her it just represented bugs in general she reluctantly accepted that fact. My daughters have short attention spans, therefore I only did 10 boxes to mark because I figured after they spotted the first several bugs they would be over looking for bugs. Bugs are abundant in our backyard if they pay attention they could find 100’s in seconds if they wanted, again I just kept it at a broad spectrum and told her we can look for any specific bugs we want. For example if she wanted to look only for spiders we could do that.
After filling out the chart and coming back inside for the day my daughters and I sit down and we talk about our data. I have my oldest count how many boxes she marked in each category. She had found 0 bunnies and 0 frogs, so I asked her which animals were spotted the same amount of times. Then I asked what animal was spotted the most times, the least? I made a graph to go along with the chart to fill out and see the data in a more visual way.

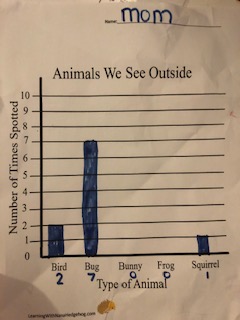
I work best myself if I have a visual aid to remind me of everything I need to explain to a child that is learning basic information. I made a demonstration graph to keep me on track to talk about the key points of a graph to my daughter as we did our graphing activity. Also for her reference in the future.


I laminated my sheets for durability, instead of wasting laminated pouches or if you don’t have a laminator reusable dry erase pockets are a perfect solution. The other items above are helpful visual aids when it comes to counting and or math skills. (I am a participant in Amazon affiliates and any qualifying purchases made through Amazon links above I earn commission on at no extra cost to you.)
